| Location: Home > Papers |
| First Author: | SHI Jiayan |
| Abstract: |
The long-term monitoring of atmospheric mercury is an important part of the effective evaluation of the Minamata Convention on Mercury. Gaseous elemental mercury (GEM), along with conventional air pollutants and meteorological parameters, was simultaneously observed in Xiamen, Southeast China, in January and July over the period 2012–2020. GEM concentrations in January were highest in 2015 (4.47 ng m-3) and decreased by 2020 (3.93 ng m-3), while GEM concentrations in July were highest in 2017 (2.65 ng m-3) and lowest in 2020 (1.56 ng m-3). The temporal variation of GEM was typically characterized by higher concentrations in winter than in summer and in nighttime than in daytime. Bivariate polar plots and the concentration-weighted trajectory (CWT) model were used to identify the source regions of GEM on a local and regional scale. The results indicate that the high GEM concentrations in January 2015 were likely due to a combination of high-level Hg emissions and adverse meteorological conditions. Generalized additive models (GAMs), which use a regression analysis method, were established and applied to investigate the influencing factors on the inter-annual variation of GEM. The factors anthropogenic emissions, meteorological conditions, and transportation explained 37.8 %±11.9 %, 31.4 %±9.0 %, and 30.8 %±9.9 % on average of the variation of GEM concentrations, respectively. There was a positive relationship of daily GEM concentrations with T and RH, mostly linking to natural surface emissions and Hg chemical transformations. The interpretation rate of anthropogenic emissions has significantly decreased since 2012, indicating the effectiveness of emission mitigation measures in reducing GEM concentrations in the study region.
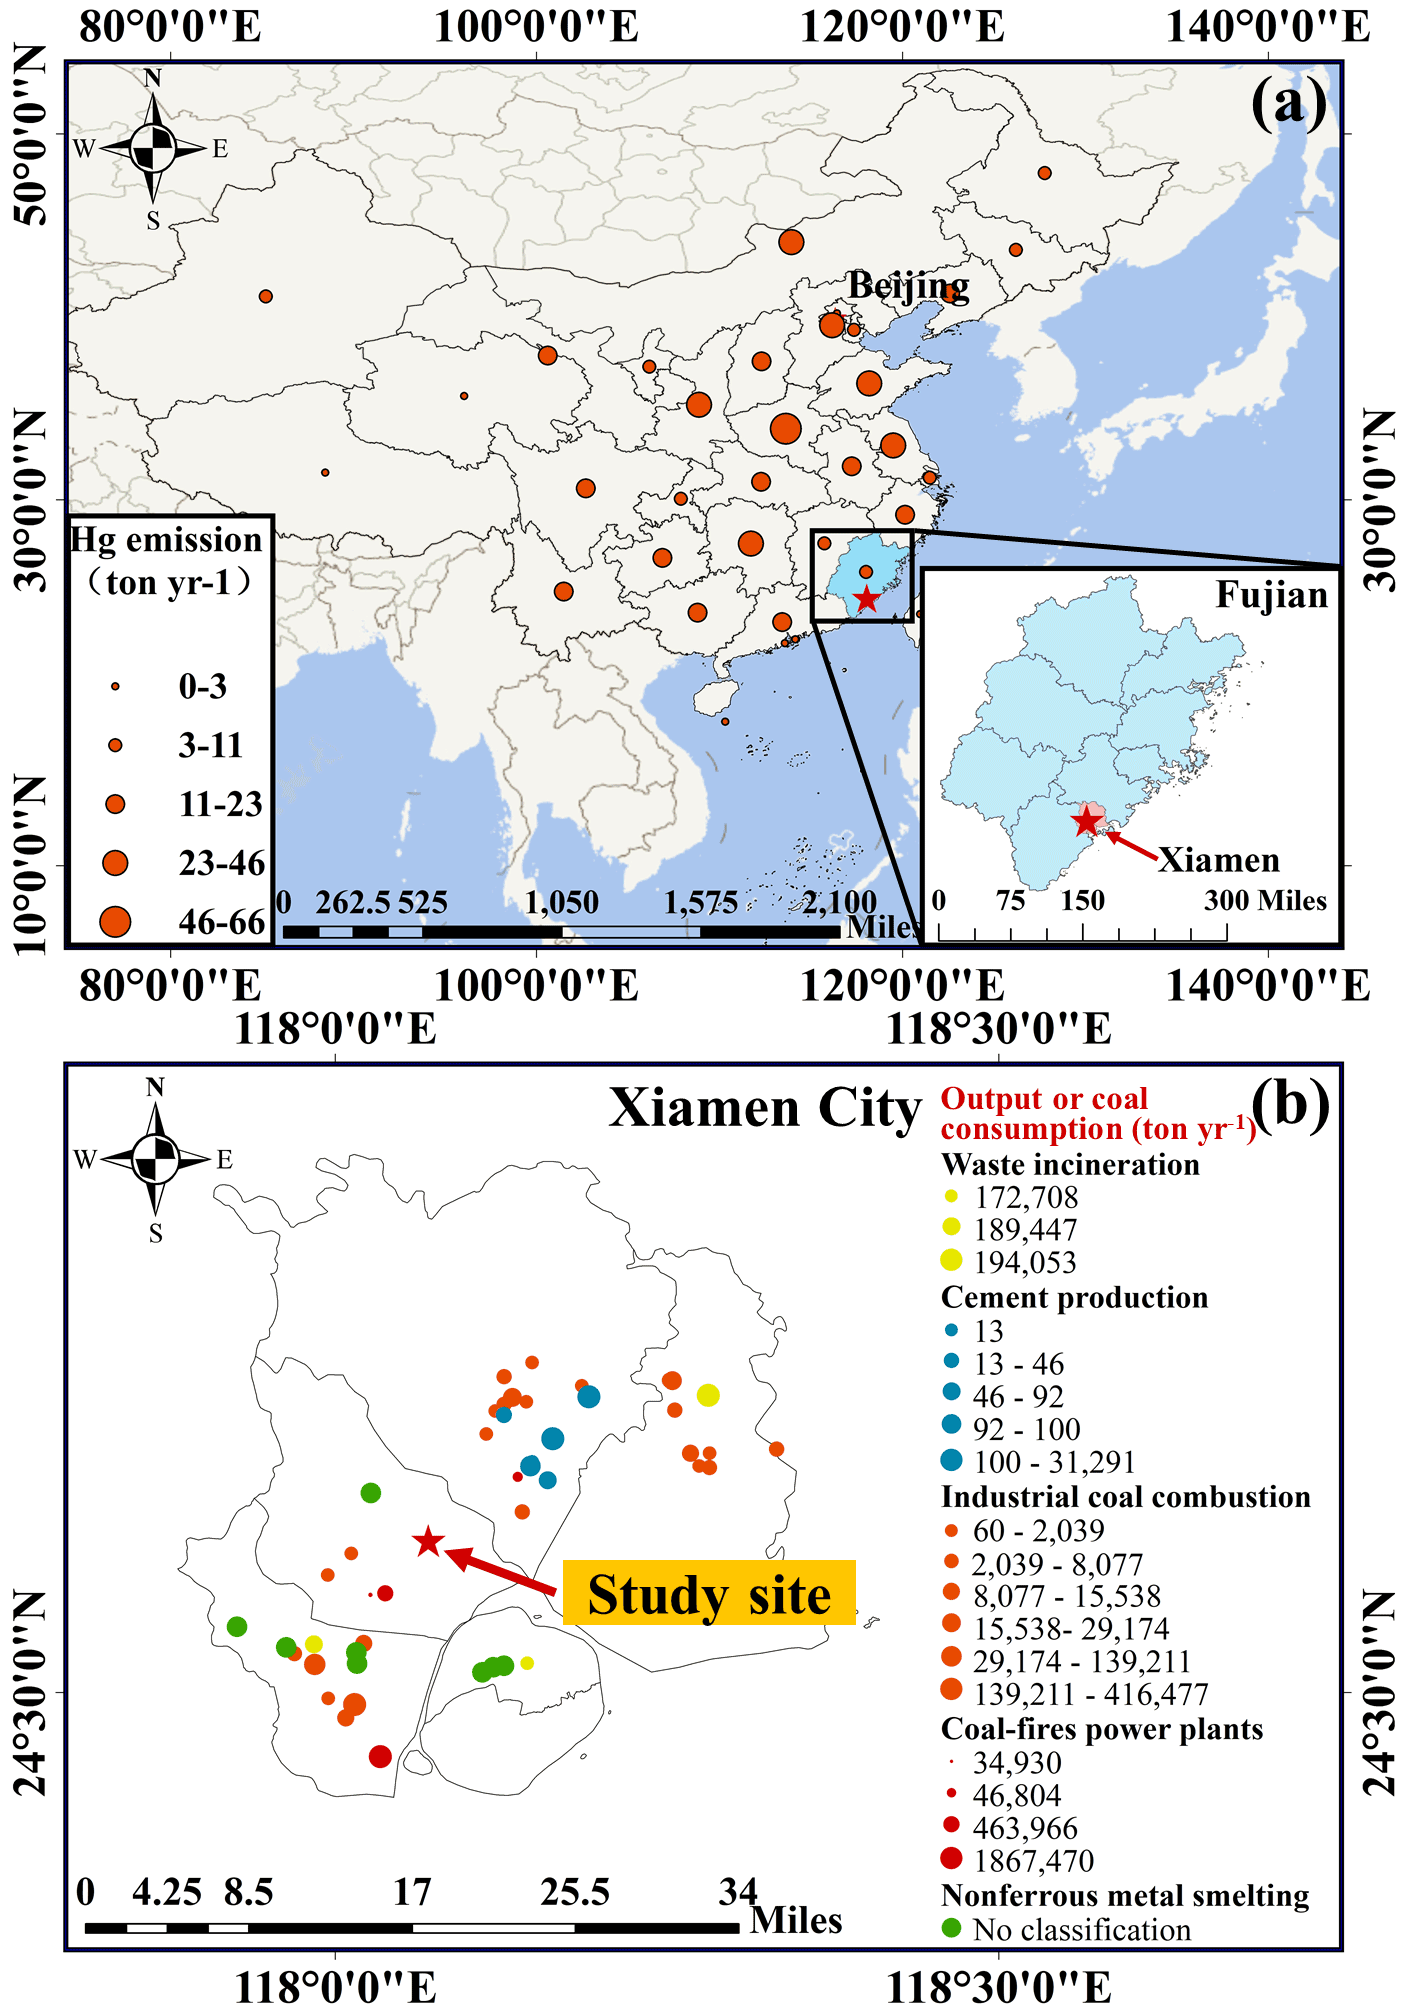
Figure 1(a) The location of study site in Xiamen, Fujian Province, China, and the regional distribution map of anthropogenic Hg emissions in China in 2014 (Wu et al., 2016). Note that the red dots represent the amount of mercury emitted by each province. (b) The distribution of local industrial point sources in Xiamen. Note that the colors of the dots represent different industrial categories, and the size represents a company's output or coal consumption (t yr-1).
|
| Contact the author: | CHEN Jinsheng,XU Lingling |
| Page Number: | 11187–11202 |
| Issue: | |
| Subject: | |
| Impact Factor: | |
| Authors units: | |
| PubYear: | September 2022 |
| Volume: | 22 |
| Publication Name: | ATMOSPHERIC CHEMISTRY AND PHYSICS |
| The full text link: | https://acp.copernicus.org/articles/22/11187/2022/ |
| ISSN: | |
| Appendix: |
